Personal income sets record. Bond market bet on inflation may get challenged.
Everyone – well, not quite everyone – is sitting on the edge of their chair wanting to know how the economy did in the first quarter. This edge-sitting has been complicated by the government shutdown which impacted the timing (delays) and perhaps the quality of the data (as seen by the sharp month-to-month zigzags).
So today, the Bureau of Economic Analysis released on schedule its February personal income figures; and behind schedule, it finally released consumer spending data for January, but February spending data is still delayed. For the economy, consumer spending is a biggie. So at least we have January now, because December had been an outlier in terms of being lousy, after a strong October and November.
So still, things are still messed up in the government-shutdown manner, but a pattern begins to emerge: Consumer spending has backed off from its red-hot pace through the third quarter last year. The backing-off phase started in the fourth quarter, and now in Q1 consumer spending is further backing off from this red-hot pace in mid-2018. Consumer spending is still growing – but merely in the post-Financial Crisis normal-ish range. Economic growth in Q1 is shaping up to be weaker than last year, but it’s still growth.
Personal income growth is solid.
Personal income in February increased 4.2% from February last year, to an annual rate of $18.04 trillion, a new record. This 4.2% year-over-year increase was in the range of the past two years.
Personal income in December had spiked by an inexplicable 1% from November. This was a big zig in a zigzag line, followed invariably by a sharp zag in January, all of it exaggerated perhaps by data collection problems during the government shutdown. Negative numbers being rare in this metric, it caused all kinds of gyration in the media. But now for February, we got another zig, and personal income growth is back on track.
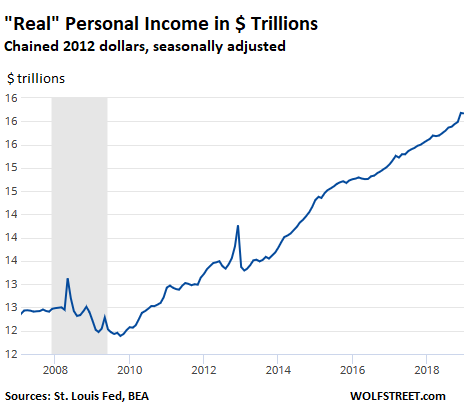
Adjusted for inflation, “real” personal income in February increased by 2.9% year-over-year, thanks to relatively low inflation, after a 3.2% increase in January, which had been the biggest increase since December 2015. This year-over-year data irons out the drama of the month-to-month zigzags. The dollar chart below of inflation-adjusted “real” personal income dispels any reason to panic about consumer incomes at the moment:
Consumer spending growth reverts to post-Financial-Crisis “normal”
Still trying to catch up from the shutdown, the BEA wasn’t able to put together its February personal consumption expenditures (PCE) data. But we finally got the delayed January PCE data this morning.
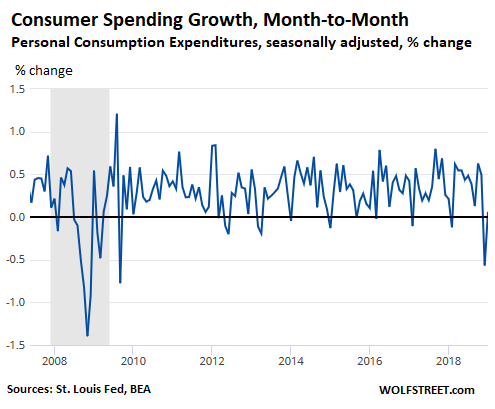
On a month-to-month basis, consumer spending on goods and services – from buying cars to paying for health insurance and rent – ticked up 0.1% from December, the zig after December’s awful zag, that had followed strong October and November spending data. The chart below shows this whiplash data of month-to-month change in percentages:
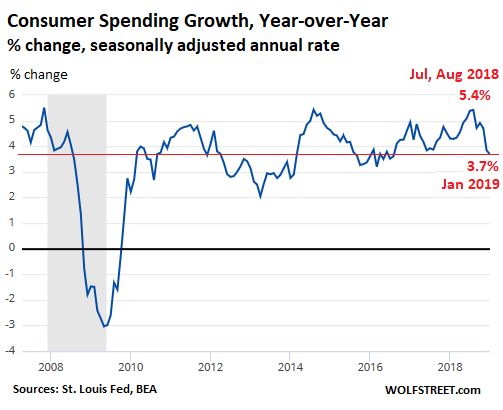
The trend becomes better visible when comparing the current month to the same month a year earlier. Year-over-year, spending rose 3.7% in January, which is still fairly solid, but the trend is down from the red-hot pace in mid-2018, which had peaked with 5.4% increases in July and August. As the chart shows, any overshoot of 5% is eventually followed by an undershoot:
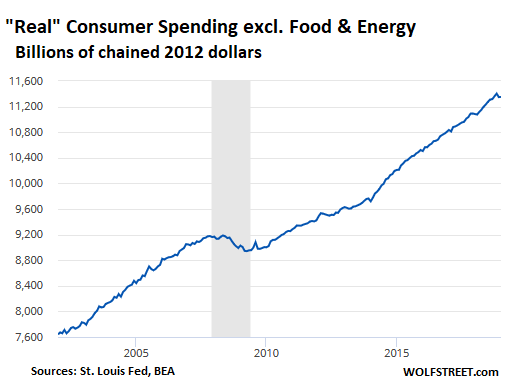
On an inflation-adjusted basis, “real” consumer spending without the volatile sectors of food and energy increased 2.4% from a year ago, also in the middle of the range since 2011. The chart below shows “real” consumer spending excluding food and energy, in inflation-adjusted dollars. Note the little dimple at the end of the line, but dimples like this are not that unusual. For a downturn in consumer spending that is big enough to turn GDP growth negative (recessionary environment), we would have to see a larger and sustained dimple:
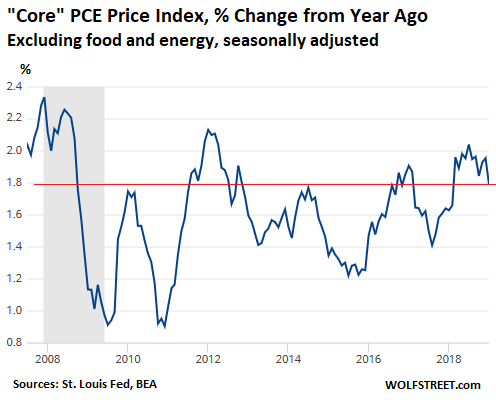
Fed’s favorite inflation measure near target
The Fed’s preferred inflation indicator, the PCE price index without food and energy, for January was also released this morning. The year-over-year increase of 1.8% is just two notches below the Fed’s target (not a “minimum” but a “target”). The oil bust that re-started last September is gently working its way into services, such as transportation services, via lower fuel prices. But this measure of inflation that the Fed constantly cites remains at the upper portion of the range since 2011, and the bond market might be in for a surprise on the inflation front as the effects of the oil bust are getting washed out of the year-over-year comparisons:
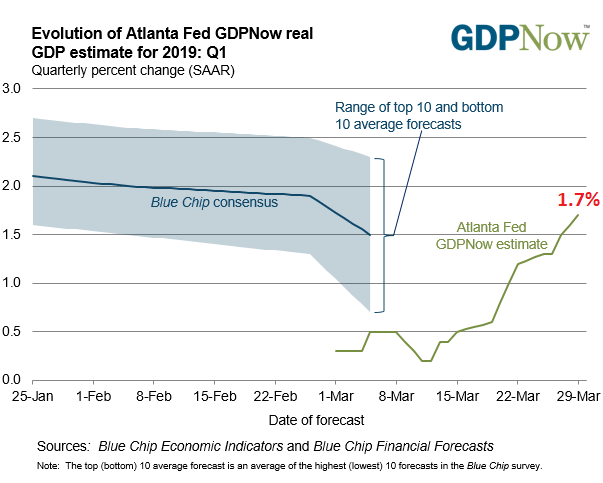
And the Atlanta Fed’s GDPNow – after a widely mediatized horrible start for Q1 on very little data because most was delayed – has been picking up the flow of delayed data. From the original estimates for Q1 of 0.3% GDP growth, it rose today to 1.7%, which is in a range that makes sense:
Much of the data for Q1, including the all-important data for February and March consumer spending, are still not available, and it’s still too early to draw conclusions. But the trends show slowing growth, heading back to post-Financial-Crisis normal, without signs of a recession at the moment.
Enjoy reading WOLF STREET and want to support it? Using ad blockers – I totally get why – but want to support the site? You can donate “beer money.” I appreciate it immensely. Click on the beer mug to find out how:

Would you like to be notified via email when WOLF STREET publishes a new article? Sign up here.
https://wolfstreet.com/2019/03/29/consumer-spending-weakens-to-normal-range-after-red-hot-mid-2018/
2019-03-29 18:40:48Z
52780254237407
Bagikan Berita Ini


0 Response to "Consumers Revert to “Normal” Range, after Red-Hot mid-2018 - WOLF STREET"
Post a Comment